A few weeks ago we posted a survey on our various platforms. Over 60 people participated, and helped us gather some interesting information about the community, as well as about the games that have been offered at past Roleplaying Jams. The survey was anonymous, but since we’re a primarily English-speaking community, we were interested in demographic statistics ranging from age and gender also to native language and language preference for roleplaying games. Here are the results, finally!
Let’s start with the simple demographics. The survey has shown that we have a majority of male gamers by about two-thirds:

Regarding age, most gamers appear to be in their late twenties with some in their early thirties:

When comparing age and gender, there are no significant differences between the distribution of male and female gamers, though most non-binary gamers appear to be younger on average:

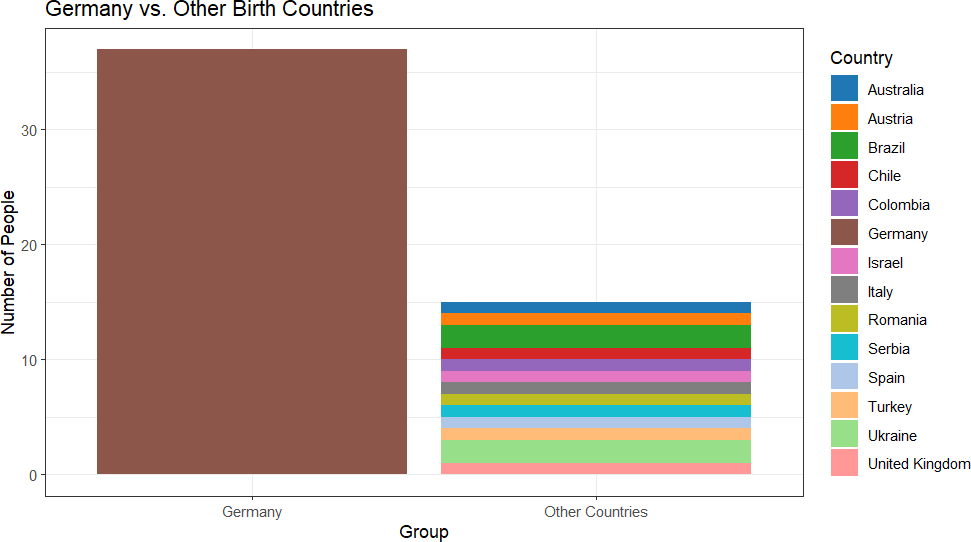
So where is everybody from? We also asked people to provide their country of birth, and despite this being a very international community, the vast majority of people who completed the survey were born in Germany. However, birth country doesn’t necessarily tell us much about the person’s identity or even native language, which should be kept in mind when considering this plot:
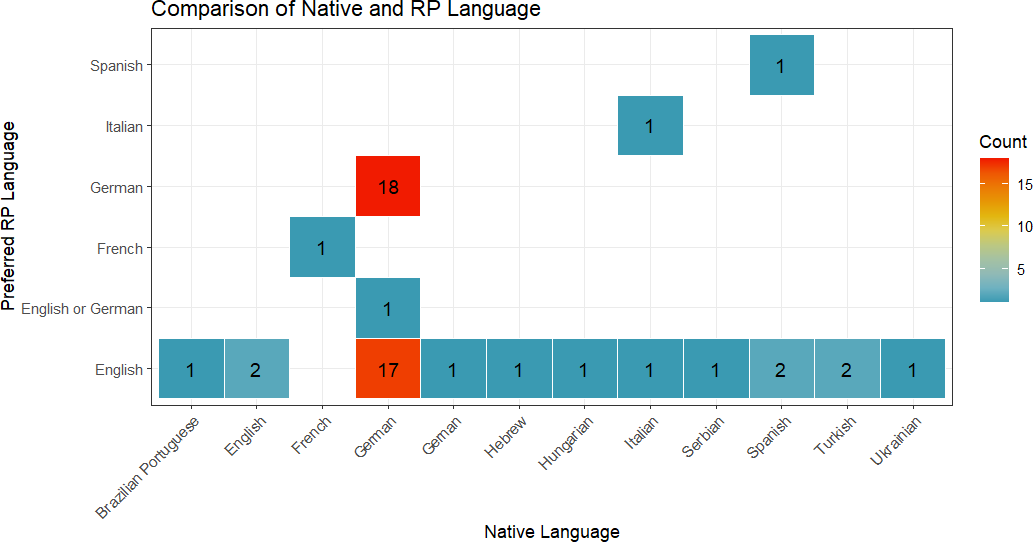
With these basic demographics out of the way, let’s look at what we were really interested in learning from this survey; native languages, and language preferences when roleplaying! For this, we asked people which language they would consider as their native language, and in which languages they prefer to play roleplaying games. This chart shows a heatmap of native language (x-axis) and first preferred roleplaying language (y-axis). We can see that most people’s native language is German, but there is an almost even split between all Germans on whether they prefer to roleplay in English or German:
We also asked people to indicate a second preference for roleplaying language, and it’s almost the same, flipped:
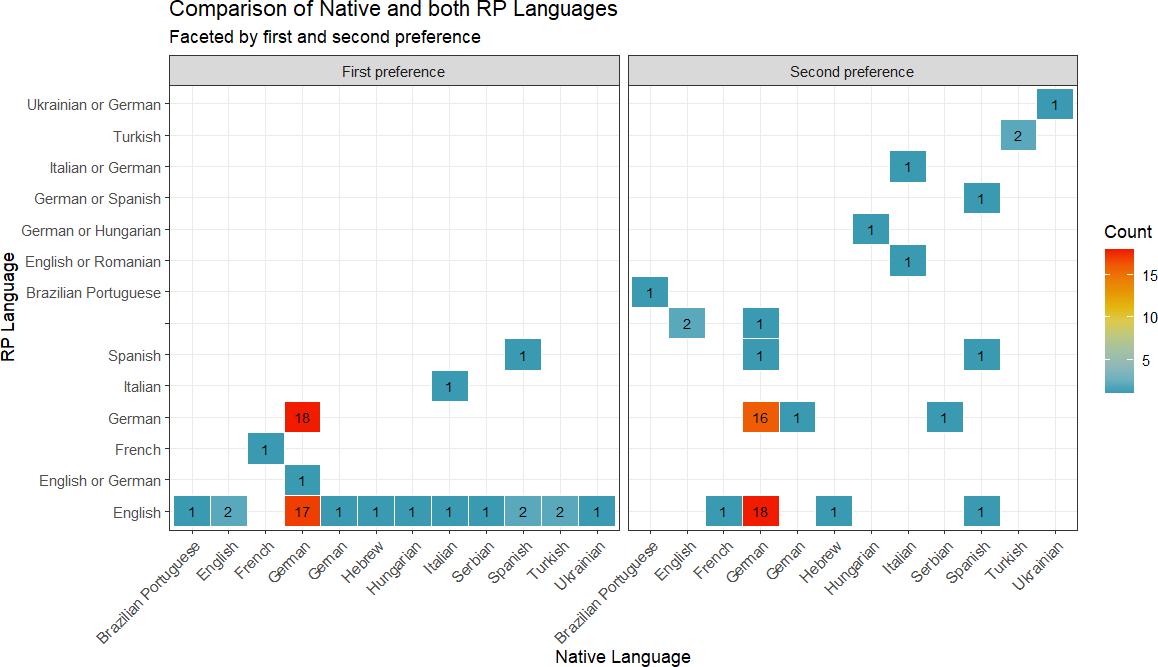
Since there are plenty of game masters in the community, we also asked in which language they would prefer to run their games. Again, this plot looks very similar, with most survey participants having German as their second language, and an almost equal split for preferring to run games in English or German. However, most speakers of other languages also seem to prefer to run games in English:

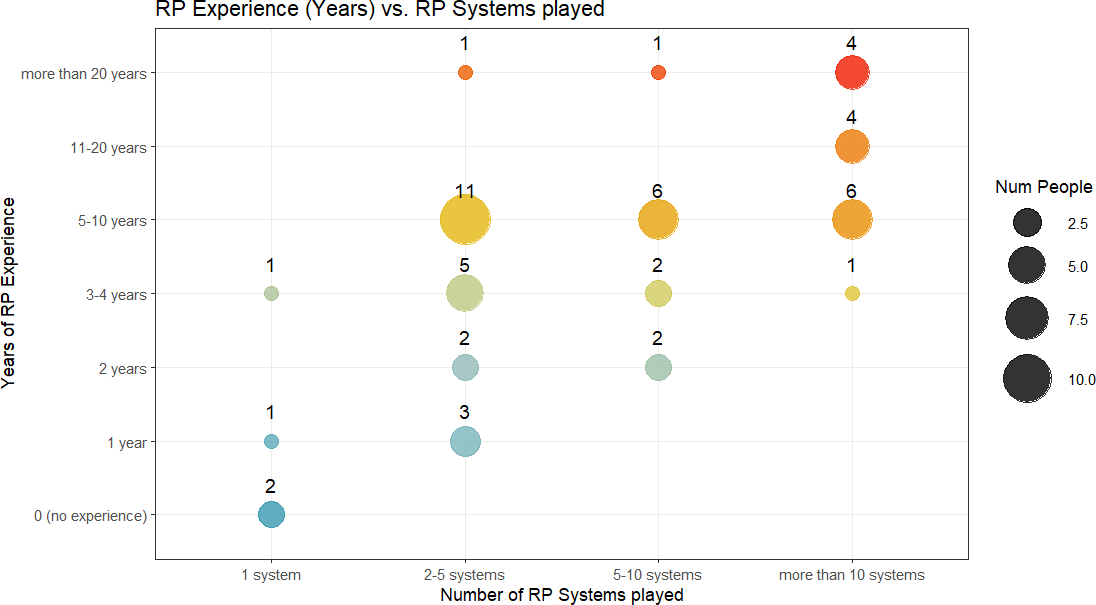
We also asked participants how experienced they are in playing roleplaying games. For this, we asked two questions; how many years they’ve been playing, and how many different roleplaying systems they’re played. The results of both questions are plotted in this dot plot, showing that a lot of people have played between 2-5 different systems, and have been playing for 5-10 years. Unsurprisingly, these two variables correlate moderately with each other (pearson correlation = 0.61). The size of the dot represents the number of people to which these intersections apply:
Similarly, we also asked how experienced our participants are as game masters based on self-evaluation in 4 categories, and plotted this comparing it to the number of systems played, resulting in this dot plot:

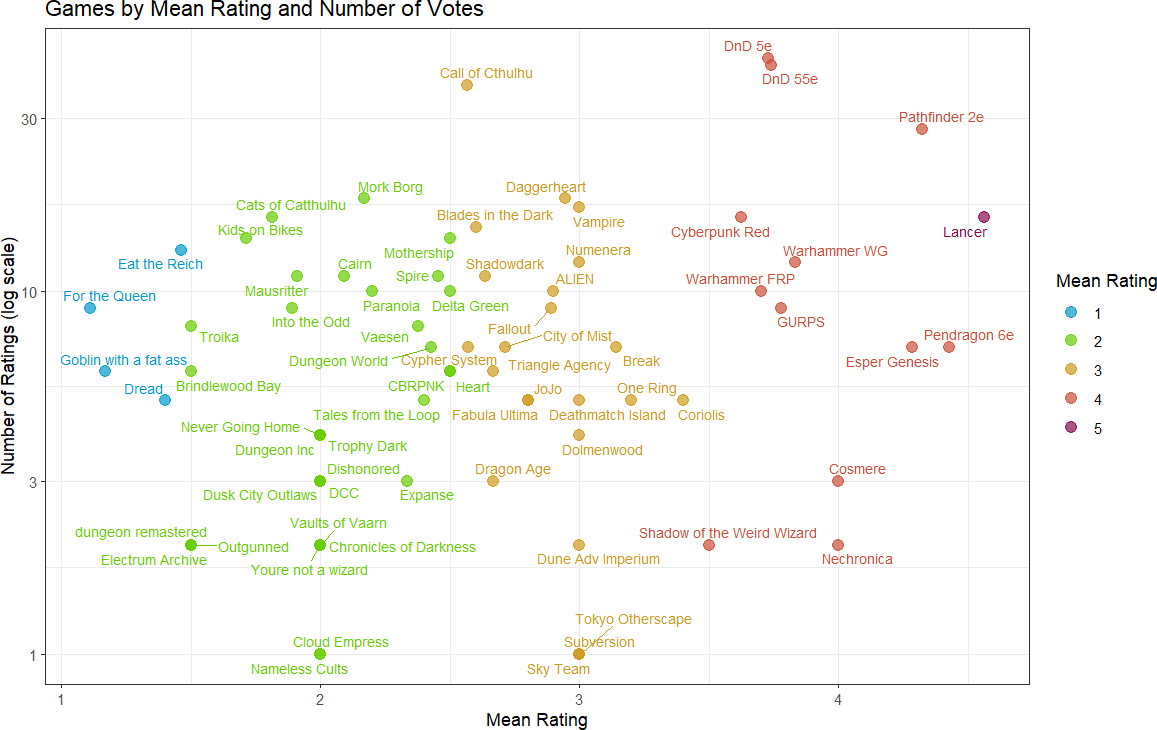
Finally, a part of the survey was also to evaluate a number of roleplaying games on a scale of 1 to 5, where 1 is “beginner-friendly, rule-lite” and 5 is “very complex, rules-heavy”. These games were all games that were run at past Roleplaying Jams, or that were proposed for future ones. There were quite a lot of games in this dataset, and they are plotted here by their average rating on the x-axis, and the number of votes these games receive in the survey on the y-axis:
This concludes our survey results! This survey delivered some very interesting insights and will help shape future roleplaying events organized by the Düsselgamers community.